Photon Application Analytics
The Photon Cloud records a set of analytics counters per application to help measure success and identify potential problems.
To access the counters, open the Photon Dashboard and click on the Analyze button for a given app.
General
Initially, the analytics page opens with a single counter: CCU, showing the data for "All Regions" in the past week.
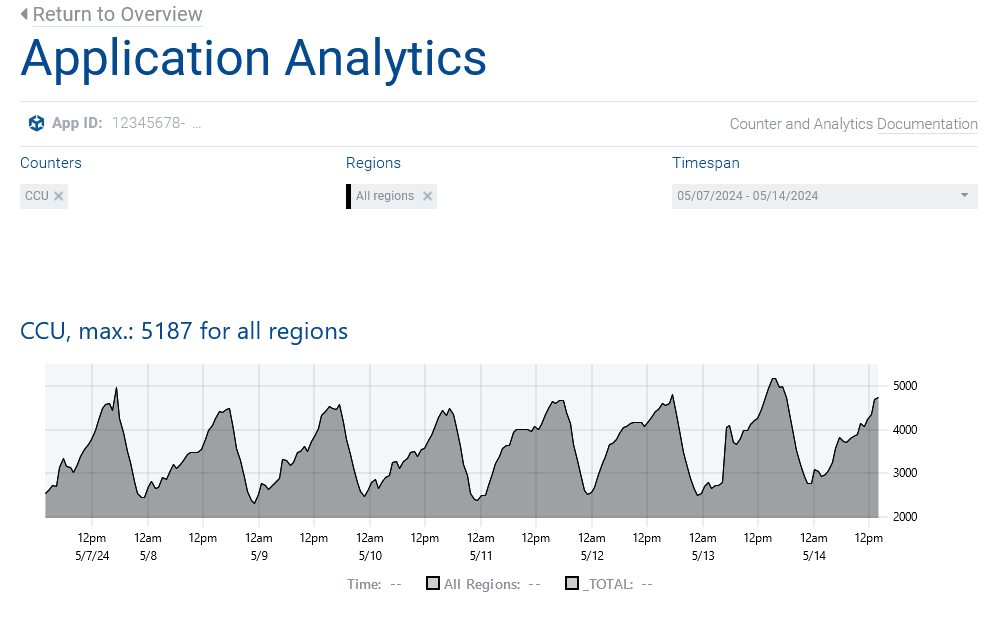
Clicking below Counters, Regions or Timespan will reveal more options to customize the view. Changing the selection refreshes the view and stores it in your browser.
The Regions category only includes regions which had some user activity, so some regions might not show up even if they are available to your users.
The "All Regions" counter wraps up all regional counters, even if they are not shown individually.
Independent of the regional timezones, all values use UTC timestamps.
Within the loaded timespan, you can zoom into the data per graph: Click and drag with the mouse, doubleclick to reset.
To get an overview of billable values (CCUs, Traffic, etc.) make sure to include "All Regions" and select a month as timespan.
Free apps are restricted to the 24 hours timespan and the "All Regions" graphs.
Available Application Counters
CCU
App users connected at a given moment (includes users in matchmaking and rooms).
CCU Peaks
Peak CCU for the given timespan.
Select a “monthly” view and include the "All Regions" counter to estimate billable use.
Rooms
Rooms in use at a given moment.
CCU per Room
Approximated by dividing the CCU by the rooms in use.
Msg/s per Room
Approximated by dividing the sum of messages/s by the rooms in use (both counted by game servers).
Bandwidth/s
Sum of the bytes/s reported by game servers.
Bandwidth/s per Peer
Approximated by dividing bandwidth/s by the CCU.
Traffic
Accumulated traffic for the loaded timespan.
Select a “monthly” view and include the "All Regions" counter to estimate billable use.
Disconnects/s per Peer
Approximated by dividing the disconnects/sec counter by the CCU.
About the Data
"All Regions"
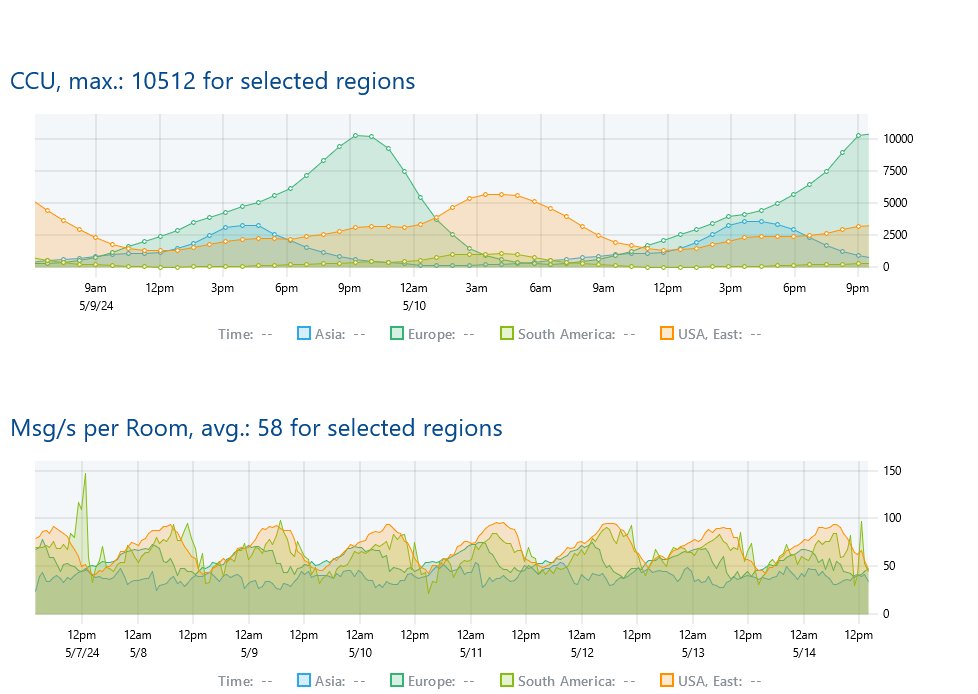
When you choose "all regions" from the regions select, a new graph will show in addition to the other regions selected.
For the application counters "Msg/s per Room", "Bandwidth/s per Peer" and "CCU per Room" it shows as the respective average for your app across all available regions.
Other charts render "all regions" as the topmost graph represeting the sum of the values of the same counter for all available regions.
"Bandwidth" vs. "Traffic"
Intentionally, we differ between the traffic (referred to as the amount of bytes consumed by your application in the queried timespan or "volume of the pipeline") and the bandwidth (referred to as bytes per second your app is using or "the pipeline's diameter").
Custom Analytics
As your audience grows you might want to take a different look at your game data.
Our Counter API is available with Premium and Enterprise plans and enables you to fetch the application counters from remote. Aside from the data available in our Dashboard, there are several other counters you could access this way.
If you are interested in using the Counter API, please mail us to hello@photonengine.com.
Back to top